Add a plot of a the average spectral power of a continous wavelet transform
Source:R/add_wavelet_avg.R
add_wavelet_avg.RdGenerates a plot of a the average spectral power of a continous wavelet transform which can be added to a larger composite plot
Usage
add_wavelet_avg(
  wavelet = NULL,
  plot_horizontal = TRUE,
  add_abline_h = NULL,
  add_abline_v = NULL,
  lowerPeriod = NULL,
  upperPeriod = NULL
)
Arguments
- wavelet
Wavelet object (list) created with
analyse_wavelet; its elementsPeriodandPower.avg(time-averaged power) are plotted. Required (Default=NULLgives an error).- plot_horizontal
Orientation of the plot (logical, TRUE or FALSE):
TRUEputs period on the x axis and average power on the y axis (to sit above a horizontal scalogram);FALSEputs period on the y axis and average power on the x axis (to sit beside a vertical scalogram). The period axis labels are suppressed in both cases.Default=TRUE.- add_abline_h
Positions of horizontal reference lines (numeric vector, e.g.
c(2, 3, 5, 6)): average power values whenplot_horizontal=TRUE, periods whenplot_horizontal=FALSE.NULLdraws none.Default=NULL.- add_abline_v
Positions of vertical reference lines (numeric vector, e.g.
c(2, 3, 5, 6)): periods whenplot_horizontal=TRUE, average power values whenplot_horizontal=FALSE.NULLdraws none.Default=NULL.- lowerPeriod
Shortest period shown on the (logarithmic) period axis, in the same unit as the depth/time axis of the wavelet (numeric, > 0). Give it together with
upperPeriod; if both areNULLthe full period range is shown.Default=NULL.- upperPeriod
Longest period shown on the period axis (numeric, >
lowerPeriod); seelowerPeriod.Default=NULL.
References
Angi Roesch and Harald Schmidbauer (2018). WaveletComp: Computational Wavelet Analysis. R package version 1.1. https://CRAN.R-project.org/package=WaveletComp
Gouhier TC, Grinsted A, Simko V (2021). R package biwavelet: Conduct Univariate and Bivariate Wavelet Analyses. (Version 0.20.21), https://github.com/tgouhier/biwavelet
Torrence, C., and G. P. Compo. 1998. A Practical Guide to Wavelet Analysis. Bulletin of the American Meteorological Society 79:61-78. https://paos.colorado.edu/research/wavelets/bams_79_01_0061.pdf
Morlet, Jean, Georges Arens, Eliane Fourgeau, and Dominique Glard. "Wave propagation and sampling theory—Part I: Complex signal and scattering in multilayered media. " Geophysics 47, no. 2 (1982): 203-221.
J. Morlet, G. Arens, E. Fourgeau, D. Giard; Wave propagation and sampling theory; Part II, Sampling theory and complex waves. Geophysics 1982 47 (2): 222–236.
Author
Code based on the "analyze.wavelet" and "wt.image" functions of the 'WaveletComp' R package and "wt" function of the 'biwavelet' R package which are based on the wavelet MATLAB code written by Christopher Torrence and Gibert P. Compo (1998). The MTM analysis is from the astrochron R package of Meyers et al., (2012)
Examples
# \donttest{
#generate a plot for the magnetic susceptibility data set of Pas et al., (2018)
oldpar <- par(no.readonly = TRUE)
plot.new()
layout.matrix <- matrix(c(rep(0, 2), 1, 0,0,seq(2, 6, by = 1)),
nrow = 2,
ncol = 5 ,
byrow = TRUE)
graphics::layout(mat = layout.matrix,
heights = c(0.25, 1),
# Heights of the two rows
widths = c(rep(c(1, 2, 4,2,2), 2)))
par(mar = c(0, 0.5, 1, 0.5))
mag_wt <-
analyse_wavelet(
data = mag,
dj = 1 / 100,
lowerPeriod = 0.1,
upperPeriod = 254,
verbose = FALSE,
omega_nr = 10
)
add_wavelet_avg(
wavelet = mag_wt,
plot_horizontal = TRUE,
add_abline_h = NULL,
add_abline_v = NULL,
lowerPeriod = 0.15,
upperPeriod = 80
)
par(mar = c(4, 4, 0, 0.5))
plot(
x = c(0, 1),
y = c(max(mag[, 1]), min(mag[, 1])),
col = "white",
xlab = "",
ylab = "Time (Ma)",
xaxt = "n",
xaxs = "i",
yaxs = "i",
ylim = rev(c(max(mag[, 1]), min(mag[, 1])))
) # Draw empty plot
polygon(
x = c(0, 1, 1, 0),
y = c(max(mag[, 1]), max(mag[, 1]), min(mag[, 1]), min(mag[, 1])),
col = geo_col("Famennian")
)
text(
0.5,
(max(mag[, 1]) - min(mag[, 1])) / 2,
"Fammenian",
cex = 1,
col = "black",
srt = 90
)
par(mar = c(4, 0.5, 0, 0.5))
plot(
mag[, 2],
mag[, 1],
type = "l",
ylim = rev(c(max(mag[, 1]), min(mag[, 1]))),
yaxs = "i",
yaxt = "n",
xlab = "Mag. suc.",
ylab = ""
)
add_wavelet(
wavelet = mag_wt,
lowerPeriod = 0.15,
upperPeriod = 80,
lower_depth_time = NULL,
upper_depth_time = NULL,
n.levels = 100,
plot.COI = TRUE,
color_brewer = "grDevices",
palette_name = "rainbow",
plot_dir = FALSE,
add_lines = NULL,
add_points = NULL,
add_abline_h = NULL,
add_abline_v = NULL,
plot_horizontal = FALSE,
period_ticks = 1,
periodlab = "period (m)",
main = NULL,
yaxt = "n",
xaxt = "s",
depth_time_lab = ""
)
lines(log2(mag_track_solution[,2]),mag_track_solution[,1],lwd=4,lty=4)
mag_405 <- extract_signal(
tracked_cycle_curve = mag_track_solution,
wavelet = mag_wt,
period_up = 1.2,
period_down = 0.8,
add_mean = TRUE,
tracked_cycle_period = 405,
extract_cycle = 405,
tune = FALSE,
plot_residual = FALSE
)
plot(mag_405[,2],mag_405[,1],type="l",
yaxt="n", yaxs = "i",
xlab="405-kyr ecc")
mag_110 <- extract_signal(
tracked_cycle_curve = mag_track_solution,
wavelet = mag_wt,
period_up = 1.25,
period_down = 0.75,
add_mean = TRUE,
tracked_cycle_period = 405,
extract_cycle = 110,
tune = FALSE,
plot_residual = FALSE
)
# amplitude of the ~110-kyr cycle from the wavelet: the tracked 405-kyr curve scaled to 110 kyr
track_110 <- cbind(mag_track_solution[, 1], mag_track_solution[, 2] * 110 / 405)
mag_110_amp <- extract_amplitude(mag_110, cycle = track_110, band = c(0.75, 1.33))
mag_110_mean <- mean(mag_110[, 2])
plot(mag_110[,2],mag_110[,1],type="l",
yaxt="n", yaxs = "i",
xlab="110-kyr ecc")
lines(mag_110_mean + mag_110_amp[, 2], mag_110_amp[, 1], col = "red")
lines(mag_110_mean - mag_110_amp[, 2], mag_110_amp[, 1], col = "red")
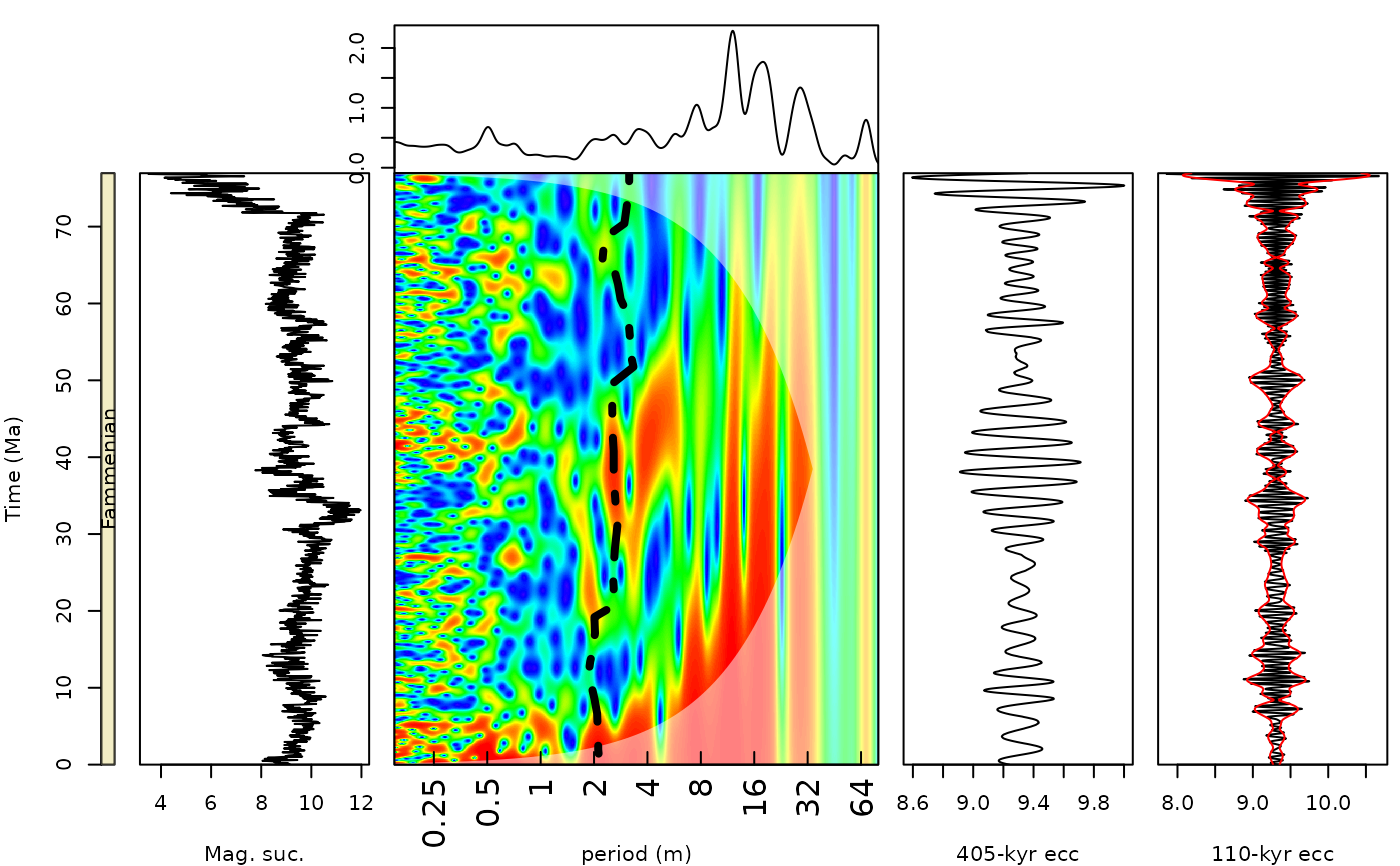 par(oldpar)
# }