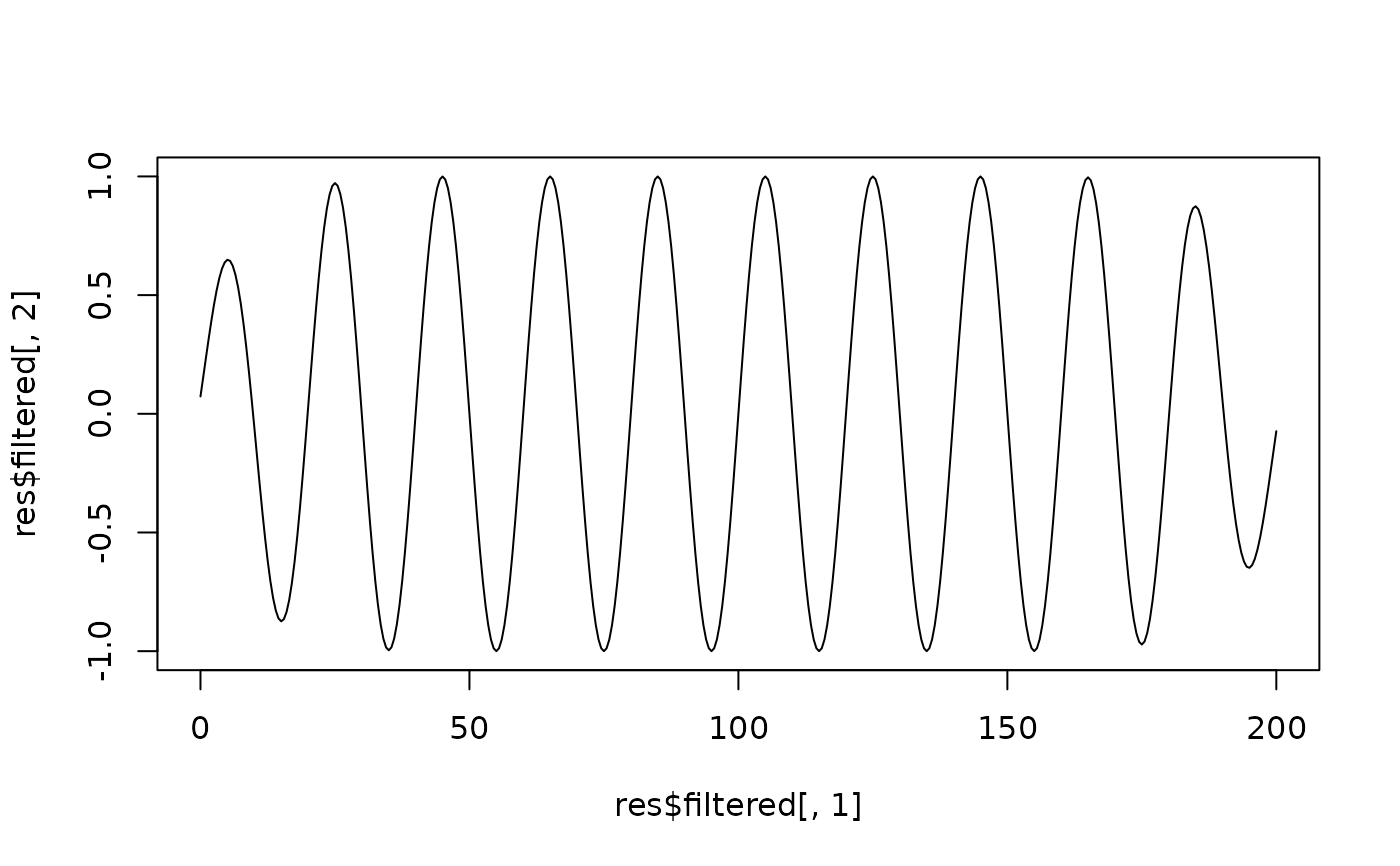
The gaussian_bandpass function applies the
Acycle Gaussian band-pass filter to a regularly sampled series. The value
mean is removed, the series is zero padded to 10 * 2^nextpow2(n)
samples and multiplied in the Fourier domain by a symmetric Gaussian
response centred on (f_low + f_high) / 2 whose lower and upper
frequencies are exact half-power (-3 dB, gain 1/sqrt(2)) points.
The amplitude envelope is the modulus of the analytic signal (MATLAB
hilbert) of the filtered series. The Gaussian parameterisation
mimics the Gaussian filter of Analyseries 2.0 (Paillard et al., 1996),
as implemented by K. Ramamurthy (2013) and corrected by L. Hinnov (2016).
Translated from Acycle v3.1 acycleBandpassFilter.m (method "gaussian")
and gaussfilter.m (Mingsong Li).
Usage
gaussian_bandpass(
  data = NULL,
  f_low = NULL,
  f_high = NULL,
  genplot = FALSE,
  x_lab = "depth",
  y_lab = "proxy"
)
Arguments
- data
Numeric two-column matrix or data frame: depth/time in column 1 (strictly increasing and regularly sampled, relative spacing tolerance 1e-5; interpolate first if needed) and the proxy value in column 2; at least eight rows, all values finite. Required (
Default=NULL).- f_low
Lower half-power (-3 dB) frequency of the pass band, in cycles per unit of the depth/time column (numeric, > 0; e.g. 1/25 to keep periods shorter than 25 m). Required (
Default=NULL).- f_high
Upper half-power (-3 dB) frequency of the pass band, in cycles per unit of the depth/time column (numeric, >
f_lowand strictly below the Nyquist frequency1 / (2 * sampling interval)). Required (Default=NULL).- genplot
Plot the demeaned data with the filtered signal and its envelope, and the filter response (logical, TRUE or FALSE).
Default=FALSE.- x_lab
Label of the x-axis of the data plot (character).
Default="depth".- y_lab
Label of the y-axis of the data plot (character).
Default="proxy".
Value
A list with elements
- filtered
matrix with columns
depth,filteredandenvelope.- response
matrix with columns
frequencyandgain: the one-sided Gaussian response (0 to Nyquist of the padded FFT grid).- f_low, f_high, f_centre
the pass band used.
- sample_interval
median sample spacing.
- nyquist
Nyquist frequency
1 / (2 * sample_interval).- nfft
length of the zero-padded FFT.
- input_mean
mean removed before filtering.
References
Li, M., Hinnov, L., Kump, L., 2019. Acycle: Time-series analysis software for paleoclimate research and education. Computers & Geosciences 127, 12-22. <doi:10.1016/j.cageo.2019.02.011>
Paillard, D., Labeyrie, L., Yiou, P., 1996. Macintosh program performs time-series analysis. Eos 77, 379. <doi:10.1029/96EO00259>