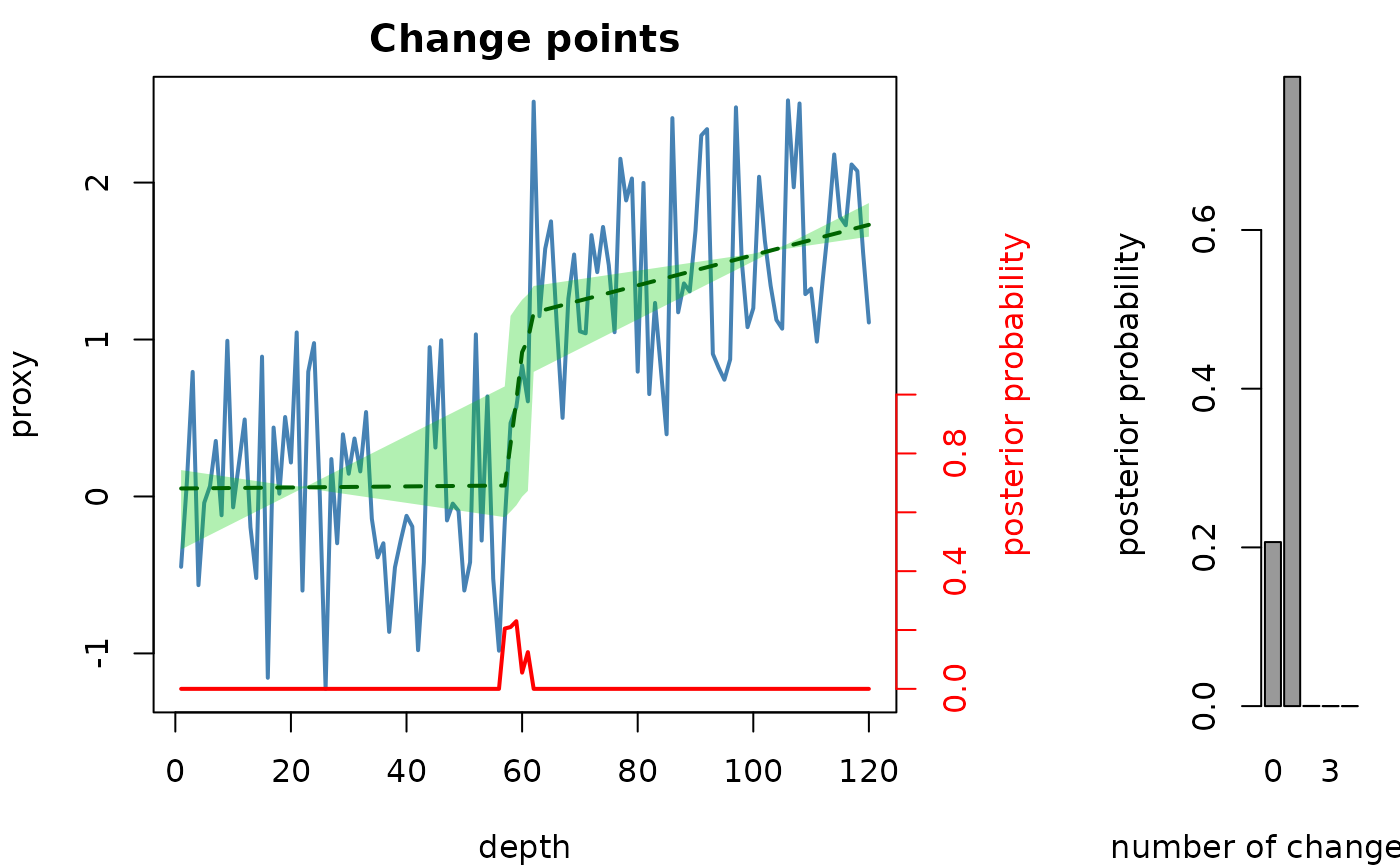
Plots the data, the posterior-mean regression model with its pointwise credible interval, and the posterior probability of a change point (right axis), as in the Acycle change point figure (bayes_cpt.m), together with the posterior distribution of the number of change points.
Arguments
- bcp
Change point result to plot: the list returned by
bayes_changepoint(itsdata,model,model_ci,cptandk_posteriorelements are used). Required (Default=NULLgives an error).- x_lab
Label of the depth/time axis (character).
Default="depth".- y_lab
Label of the proxy axis (character).
Default="proxy".- plot_k
Add a panel to the right with a bar plot of the posterior distribution of the number of change points (logical, TRUE or FALSE).
Default=TRUE.