Plots the diagnostics of a cvcoco result in the
style of Acycle's plotcvcoco.m, using base graphics. Four pages can be
drawn: (1) the two regularized folds and the held-out validation spectra
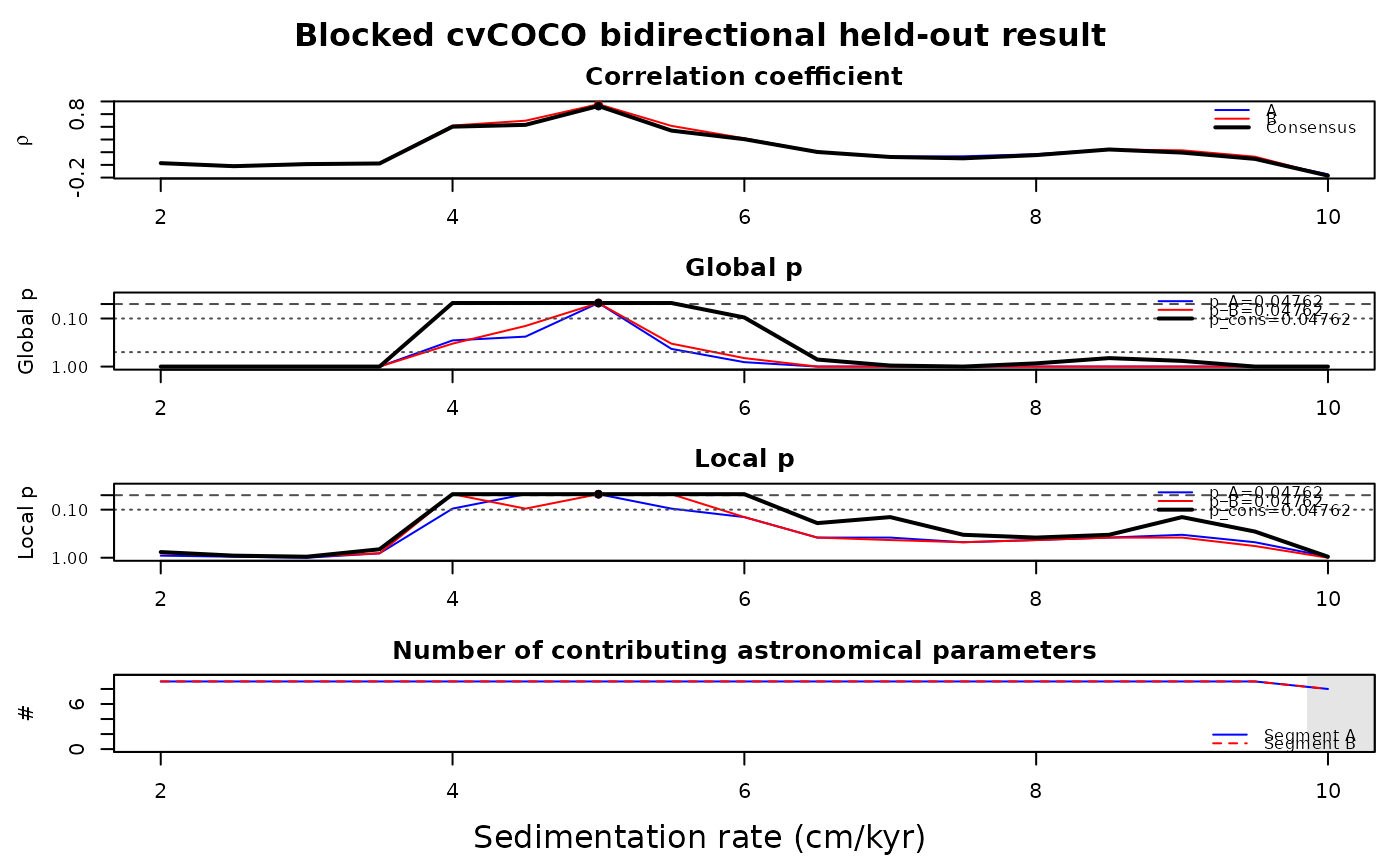
with their frozen targets, (2) the stacked result panels: directional and
consensus correlation, global p, local p and the number of resolvable
astronomical periods, (3) the consensus pCOCO curve and (4) the Monte
Carlo audit (null distributions of the consensus and directional maxima).
Translated from Acycle v3.1 plotcvcoco.m (Mingsong Li).
Usage
plot_cvcoco(result = NULL, pages = c("spectra", "result", "pcoco", "audit"))Arguments
- result
cvCOCO result to plot: the list returned by
cvcoco. Required (Default=NULLgives an error).- pages
Which pages to draw, in this order (character vector with any of):
"spectra": the two depth series (folds A and B) and the two held-out validation spectra with their frozen astronomical targets;"result": the directional and consensus correlation, global p, local p and the number of contributing astronomical periods against sedimentation rate (cm/kyr);"pcoco": the consensus pCOCO curve with its maximum marked;"audit": histograms of the Monte Carlo null distributions of the consensus and directional maxima with the observed statistics.
Values that are not in this list are ignored.
Default=c("spectra", "result", "pcoco", "audit").
References
Li, M., Kump, L.R., Hinnov, L.A., Mann, M.E., 2018. Tracking variable sedimentation rates and astronomical forcing in Phanerozoic paleoclimate proxy series with evolutionary correlation coefficients and hypothesis testing. Earth and Planetary Science Letters 501, 165-179.
Examples
# \donttest{
set.seed(3)
t_kyr <- seq(0, 1600, by = 2)
etp <- sin(2 * pi * t_kyr / 405) + 0.6 * sin(2 * pi * t_kyr / 125) +
0.8 * sin(2 * pi * t_kyr / 41) + 0.5 * sin(2 * pi * t_kyr / 23.7)
dat <- cbind(t_kyr * 5 / 100, etp + 0.5 * stats::rnorm(length(t_kyr)))
res <- cvcoco(data = dat, sr1 = 2, sr2 = 10, srstep = 0.5, n_sim = 20,
seed = 1)
plot_cvcoco(res, pages = "result")
 # }