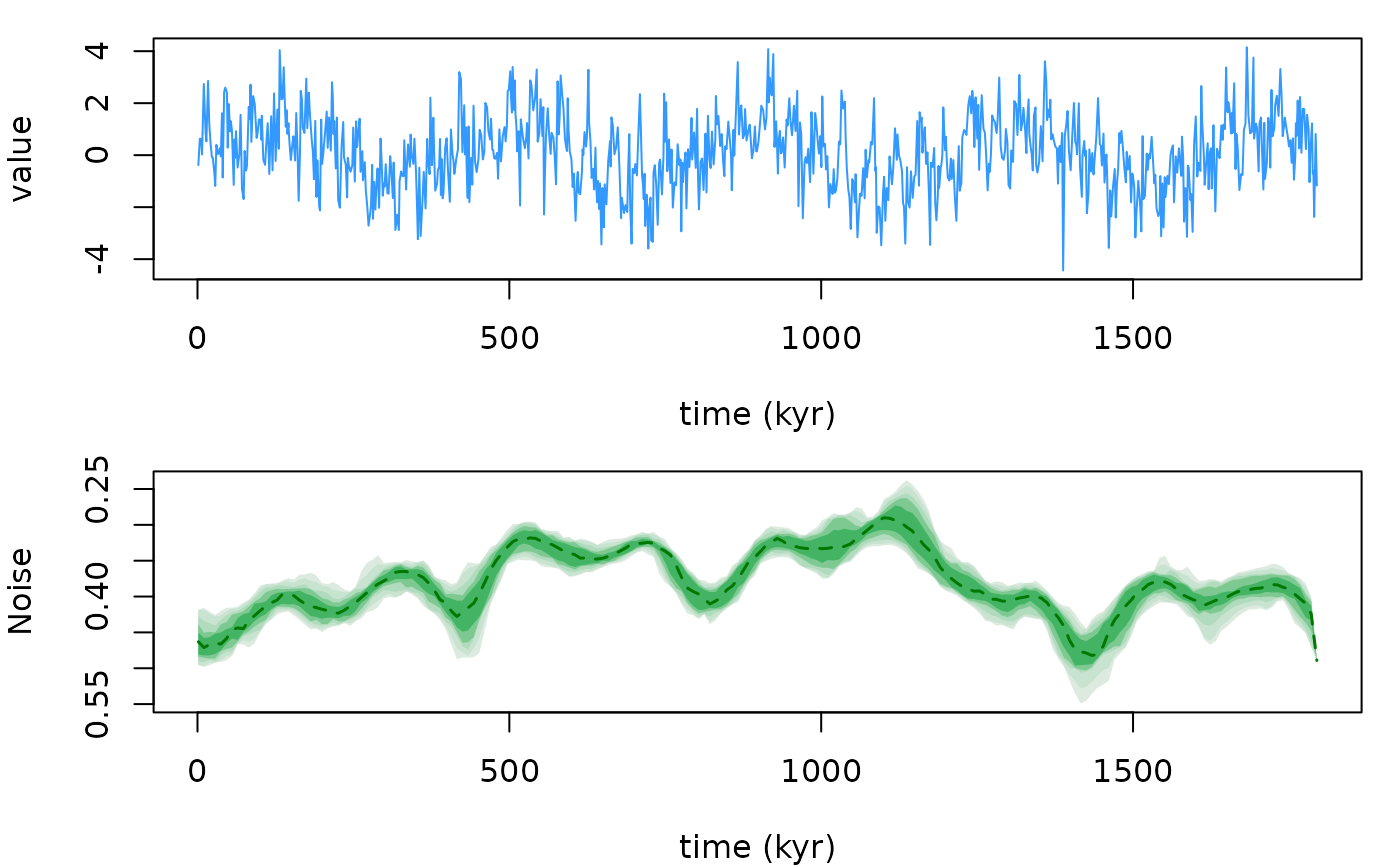
The plot_dynot function plots the input data
and the DYNOT noise model (median and confidence envelopes, reversed
y-axis) as in the Acycle DYNOT window.
Translated from the plotting part of Acycle v3.1 DYNOS.m (Mingsong Li).
Arguments
- dynot_res
DYNOT result to plot: the list returned by
dynot(itsdata,percentile,interval_countandmedian_indexelements are used). Required (Default=NULLgives an error).- plot_data
Also plot the input data in an upper panel above the noise model (logical, TRUE or FALSE); with
FALSEonly the noise panel (median and up to five confidence envelopes, reversed y-axis) is drawn.Default=TRUE.- x_lab
Label of the time axis of both panels (character).
Default="time (kyr)".
References
Li, M., Hinnov, L.A., Huang, C., Ogg, J.G., 2018. Sedimentary noise and sea levels linked to land-ocean water exchange and obliquity forcing. Nature Communications 9, 1004. doi:10.1038/s41467-018-03454-y